Your First Domain Story
Matthew runs a small movie theater for arthouse films—called Metropolis—that enjoys an excellent reputation among cineastes. One day Matthew meets his school friend Anna. When he learns that Anna has been developing apps for almost ten years, he gets an idea.
Movie theater manager Matthew: “My customers like the old-fashioned charm of my cinema. But they do not like my old-fashioned box office. Today’s moviegoers are not used to buying tickets in person at the box office anymore. Customers have been asking me to sell tickets online. Can you develop an app for me?”
App developer Anna: “You run just one cinema, and there’s only a handful of movies per week, two or three shows a day. Sounds easy.”
Matthew: “Great! But one small thing: We also show international movies in foreign languages in our program. Also, in addition to the online sales through the app, I still need the box office for less tech-savvy moviegoers. And I’d like users of the app to be able to sign up for a yearly subscription.”
Anna: “Subscriptions? Online and offline sales? Shows in foreign languages? That’s more complicated than I thought….”
The Workshop Begins
The next day they meet again in Matthew’s office. They are standing in front of a whiteboard, and Anna is holding a marker in her hand.
App developer Anna: “Yesterday you said that the app essentially has three use cases: One: selling standard tickets; two: selling special tickets for foreign-language movies; and three: signing up for a yearly subscription.”
Movie theater manager Matthew: “Uh, yes, that’s right.”
Anna: “I would like to understand how Metropolis operates today. That will help me to develop an app that meets your requirements. Could you please explain to me how you sell tickets at the box office?”
Matthew: “Sure. You sell the tickets and mark the seat in the seating plan and…”
Anna: “Wait a minute. Who sells the tickets?”
Matthew: “A cashier.”
Anna draws a stick figure on the whiteboard and writes “cashier” underneath.

Anna: “Who buys the tickets?”
Matthew: “A moviegoer. One without a subscription.”
Anna draws a second stick figure and calls it “moviegoer.” Next to it, she writes down that the moviegoer has no subscription.

Anna: “What does a moviegoer have to do to buy a ticket?”
Matthew: “They tell the cashier which show they want to see.”
Anna: “I will draw a speech bubble as an icon for the show here, because the two of them talk to each other.”
Anna continues drawing and numbers the arrow.

One Sentence After the Other
Anna: “And then?”
Matthew: “Usually the cashier suggests the best seat available.”
Anna: “Ah, so the moviegoer picks a seat in advance! How does the cashier suggest seats?”
Matthew: “I take the seating plan for the show and search for available seats. In the seating plan, I can see which seats have already been sold and which are still available.”
Anna draws and explains the icons.
Anna: “Here, I’m using a film icon instead of the speech bubble to symbolize the show.”
Matthew: “The seating plan is a grid. Can you draw a grid?”

Then, Anna reads back what she has understood.
Anna: “Second, the cashier gets the seating plan for the show. Third, they search for available seats. Is that ok?”

Matthew nods in agreement.
Anna: “And now the cashier suggests the available seats to the moviegoer?”
Matthew: “Exactly.”
Retelling and Finishing the Story
Within a few minutes, the whiteboard is filled with a story about a moviegoer who buys tickets from a cashier at the box office. Icons and arrows are rearranged during the session. Finally, Anna retells the story from the beginning.

Matthew: “Yes, that’s right. But I forgot about the international movies.”
Anna: “You mean the shows in a foreign language? I thought you sell special tickets for those.”
Matthew: “No, you only have to point out to the moviegoers which language the movie will be shown in.”
Anna: “When does the cashier do that?”
Matthew: “Here.”
Matthew points to the arrow with the number 4. Anna adds a comment “and mentions language.”

Anna: “It seems we are finished with our little ‘Going to the movies’ story. Of course, we have looked only at the best possible outcome; I call this the ‘happy path.’ I will ask you about other cases later.”
After a few more Metropolis domain stories, Anna has gained a good insight into the cinema domain. She knows terms like “seating plan,” “show,” “cashier,” “to search for available seats,” and “to mark seats.” She has an initial understanding of the most important processes. With this knowledge about the purpose of the app and its context, she can think about how the app will work and how the processes will change.
The Pictographic Language
To record domain stories visually, you need a set of building blocks and rules for combining them. The building blocks consist of icons, arrows, and text. In the examples on this website, we use Google’s Material icons that represent typical office work. You should compile your own set of pictograms that fits to your domain.
Actors

Domain stories are told from an actor’s’ perspective. An actor can be a person, a group of people, or a software system. We use different icons to represent those different kinds of actors. What actors have in common is that they play an active role in the domain story.
Work Objects

Actors create, work with, and exchange work objects such as documents, physical things, and digital objects. They also exchange information about work objects. Like actors, the work objects are labeled with a term from the domain language (like “showtimes,” “movie ticket,” etc.).
Note that a work object can have different icons within the same domain story if the medium changes. For example, a moviegoer could receive their movie ticket via email and print it at home—the same ticket is represented with two different icons.
Activities

The actors’ activities are shown as arrows and labeled with verbs from the domain language (e.g., “offers,” “buys,” “recommends”). Note: Actors and work objects are nouns, and activities are verbs.
Sequence Numbers
To tell a story, you need more than one sentence. Since stories are told one sentence after the other, the sentences can be brought into an order by numbering them. We usually number the sentences by adding a sequence number to the origin of the arrow that represents an activity (the predicate of a sentence).
Annotations

The pictographic sentences are complemented by textual annotations. Where necessary, we annotate information about variations (other cases, optional activities, possible errors). We use annotations to explain terms from the domain language, and to document assumptions or anything else that is noteworthy.
Groups

A group is represented as an outline that clusters parts of a story that somehow belong together. The group can take any form, for example a rectangle, a circle, or a free-form shape. To describe the meaning of a group, label it accordingly. Here are some examples of what can be expressed by groups:
- Activities that are repeated
- Activities that are optional
- Parts of the story taking place in different locations
- Organizational boundaries
- Subdomains
Putting It All Together
Activities connect actors and work objects to form sentences. Every sentence starts with an actor who initiates an activity:
Domain stories visualize who (actor) does what (activity) with what (work objects) with whom (other actors).
The basic syntax is: subject – predicate – object. More complex syntax is allowed as well:

Every actor appears only once in the domain story. But for every activity, we draw a separate work object (even if the same work object already exists in a previous sentence). If you follow that rule, arranging work objects and arrows becomes a lot easier. There is another good reason for this. As the story evolves, a work object may change its status or representation.
Chapter 2 of the Domain Storytelling book covers the pictographic language in more detail, including recommendations for good language style and compiling your own icon sets.
Scenario-based Modeling
Avoid Premature Abstractions
Most business process modeling approaches show what can possibly happen in a process:
Of course, there is value in “algorithmic” descriptions of business processes, and one cannot develop software without thinking about conditionals. But premature abstractions are often wrong and not useful for understanding a domain.
First establish a sound understanding of typical cases—tell stories. Only then discuss what else could happen—collect rules.

Scenarios in Domain Storytelling
A domain story is a concrete, meaningful examples of a business process. The pictographic language gets by without symbols for conditionals, variations, or alternatives. With Domain Storytelling, you model just the most important alternatives—each one as an individual domain story.
When we model a business process, every possible instance could be described in the form a domain story. How do we narrow down the vast number of instances?
We recommend you start with modeling the default case—the “80% case”—and the “happy path” first.
We will take another look at the cinema example to illustrate our approach:
The movie theater Metropolis sells (a) tickets for single shows and (b) yearly subscriptions. This means app developer Anna cannot simply ask movie theater manager Matthew to tell her a story about a moviegoer who approaches the cashier. Instead, she asks him which case is more common, and he tells her that selling tickets for single shows makes up 75% of his revenue. Therefore, Anna asks Matthew to tell her about this case.
While she is recording the story additional assumptions are made, to avoid drifting off to different story lines: “Assuming that there are still seats available, what do you do next?” Anna writes all these assumptions down as annotations.
Usually, a few domain stories are sufficient to understand a business process. Small variations in a business process such as optional activities are simply not worth the effort of modeling them separately. Instead, you should use annotations.
Chapter 3 of the Domain Storytelling book gives you more guidance on which scenarios to explore and how to keep an overview.
Scope
Domain Storytelling is not a “one-size-fits-all” approach. Depending on the purpose, the modeler chooses a fitting scope for the domain story:
- The granularity determines the level of detail: Are you interested in the overview or the details? Domain stories can be coarse-grainer, fine-grained, and everything in between.
- Domain Stories take place at a point in time. They either describe a process as it currently is (as-is) or how it will (possibly) look in the future (to-be).
- When modeling domain stories, you either include or omit (existing or yet to be built) software. This scope factor is called domain purity. We call domain stories without software systems pure, and those with software systems digitalized.
As an example, the above “selling tickets at the box office” domain story is fine-grained, as-is, and pure.
Chapter 4 of the Domain Storytelling book describes the scope factors in more detail. A short case study describes typical scopes of domain stories and how you can “travel” from one scope to the next.
The Workshop Format
You can use Domain Storytelling just as a graphical notation. But it is much more than that. It is a method for having meaningful conversations about business processes.
Domain Storytelling is a conversation technique.
Workshop participants include domain experts (often from several departments), IT experts and a moderator. All participants contribute to the story. The moderator needs to steer the storytellers in the right direction to ensure that their contributions serve the overall purpose.The moderator keeps the participants’ story going by asking questions like these:
- “What happens next?”
- “Where do you get this information?”
- “How do you determine what to do next?”
- “How do you do that?”
Engage the participants without imposing your opinion on them. Use the language of the participants, not your own!
As the participants tell their story, the moderator records it graphically—step-by-step, thus determining the pace of the storytelling. The story needs to be visible for all participants (e.g. on a whiteboard or projected on a screen). The participants see what gets recorded and give feedback immediately. Note, however, that the visualization of a domain story was not intended to be a stand-alone document. First and foremost, the picture is for the people who are telling the story while they are telling it. Later, it will serve as a memory aid for those who participated in the workshop and for telling the story to other people.
When the story seems to be finished, tell the story from the beginning and try to get agreement: Did we miss something? Is something obviously wrong? Do all domain experts agree with the story? Revisit the annotations for possible alternative stories. Let the participants decide which ones are minor variations and which deserve their own domain story.
Other artifacts of the software development process will crystallize and grow around the domain stories as well, for example context maps and requirements. You can also continue the conversation about the domain with the help of other modeling techniques, such as Example Mapping and EventStorming.
Chapter 6 of the Domain Storytelling book explains in much more depth what happens before, during, and after a workshop. It also covers remote workshops, sizing of domain stories, and how to deal with difficult situations.
Chapter 7 of the Domain Storytelling book covers the relationships between Domain Storytelling an other collaborative modeling techniques, including when to use which method and how to combine them.
Tools
Often a whiteboard and some sticky notes are all you need.
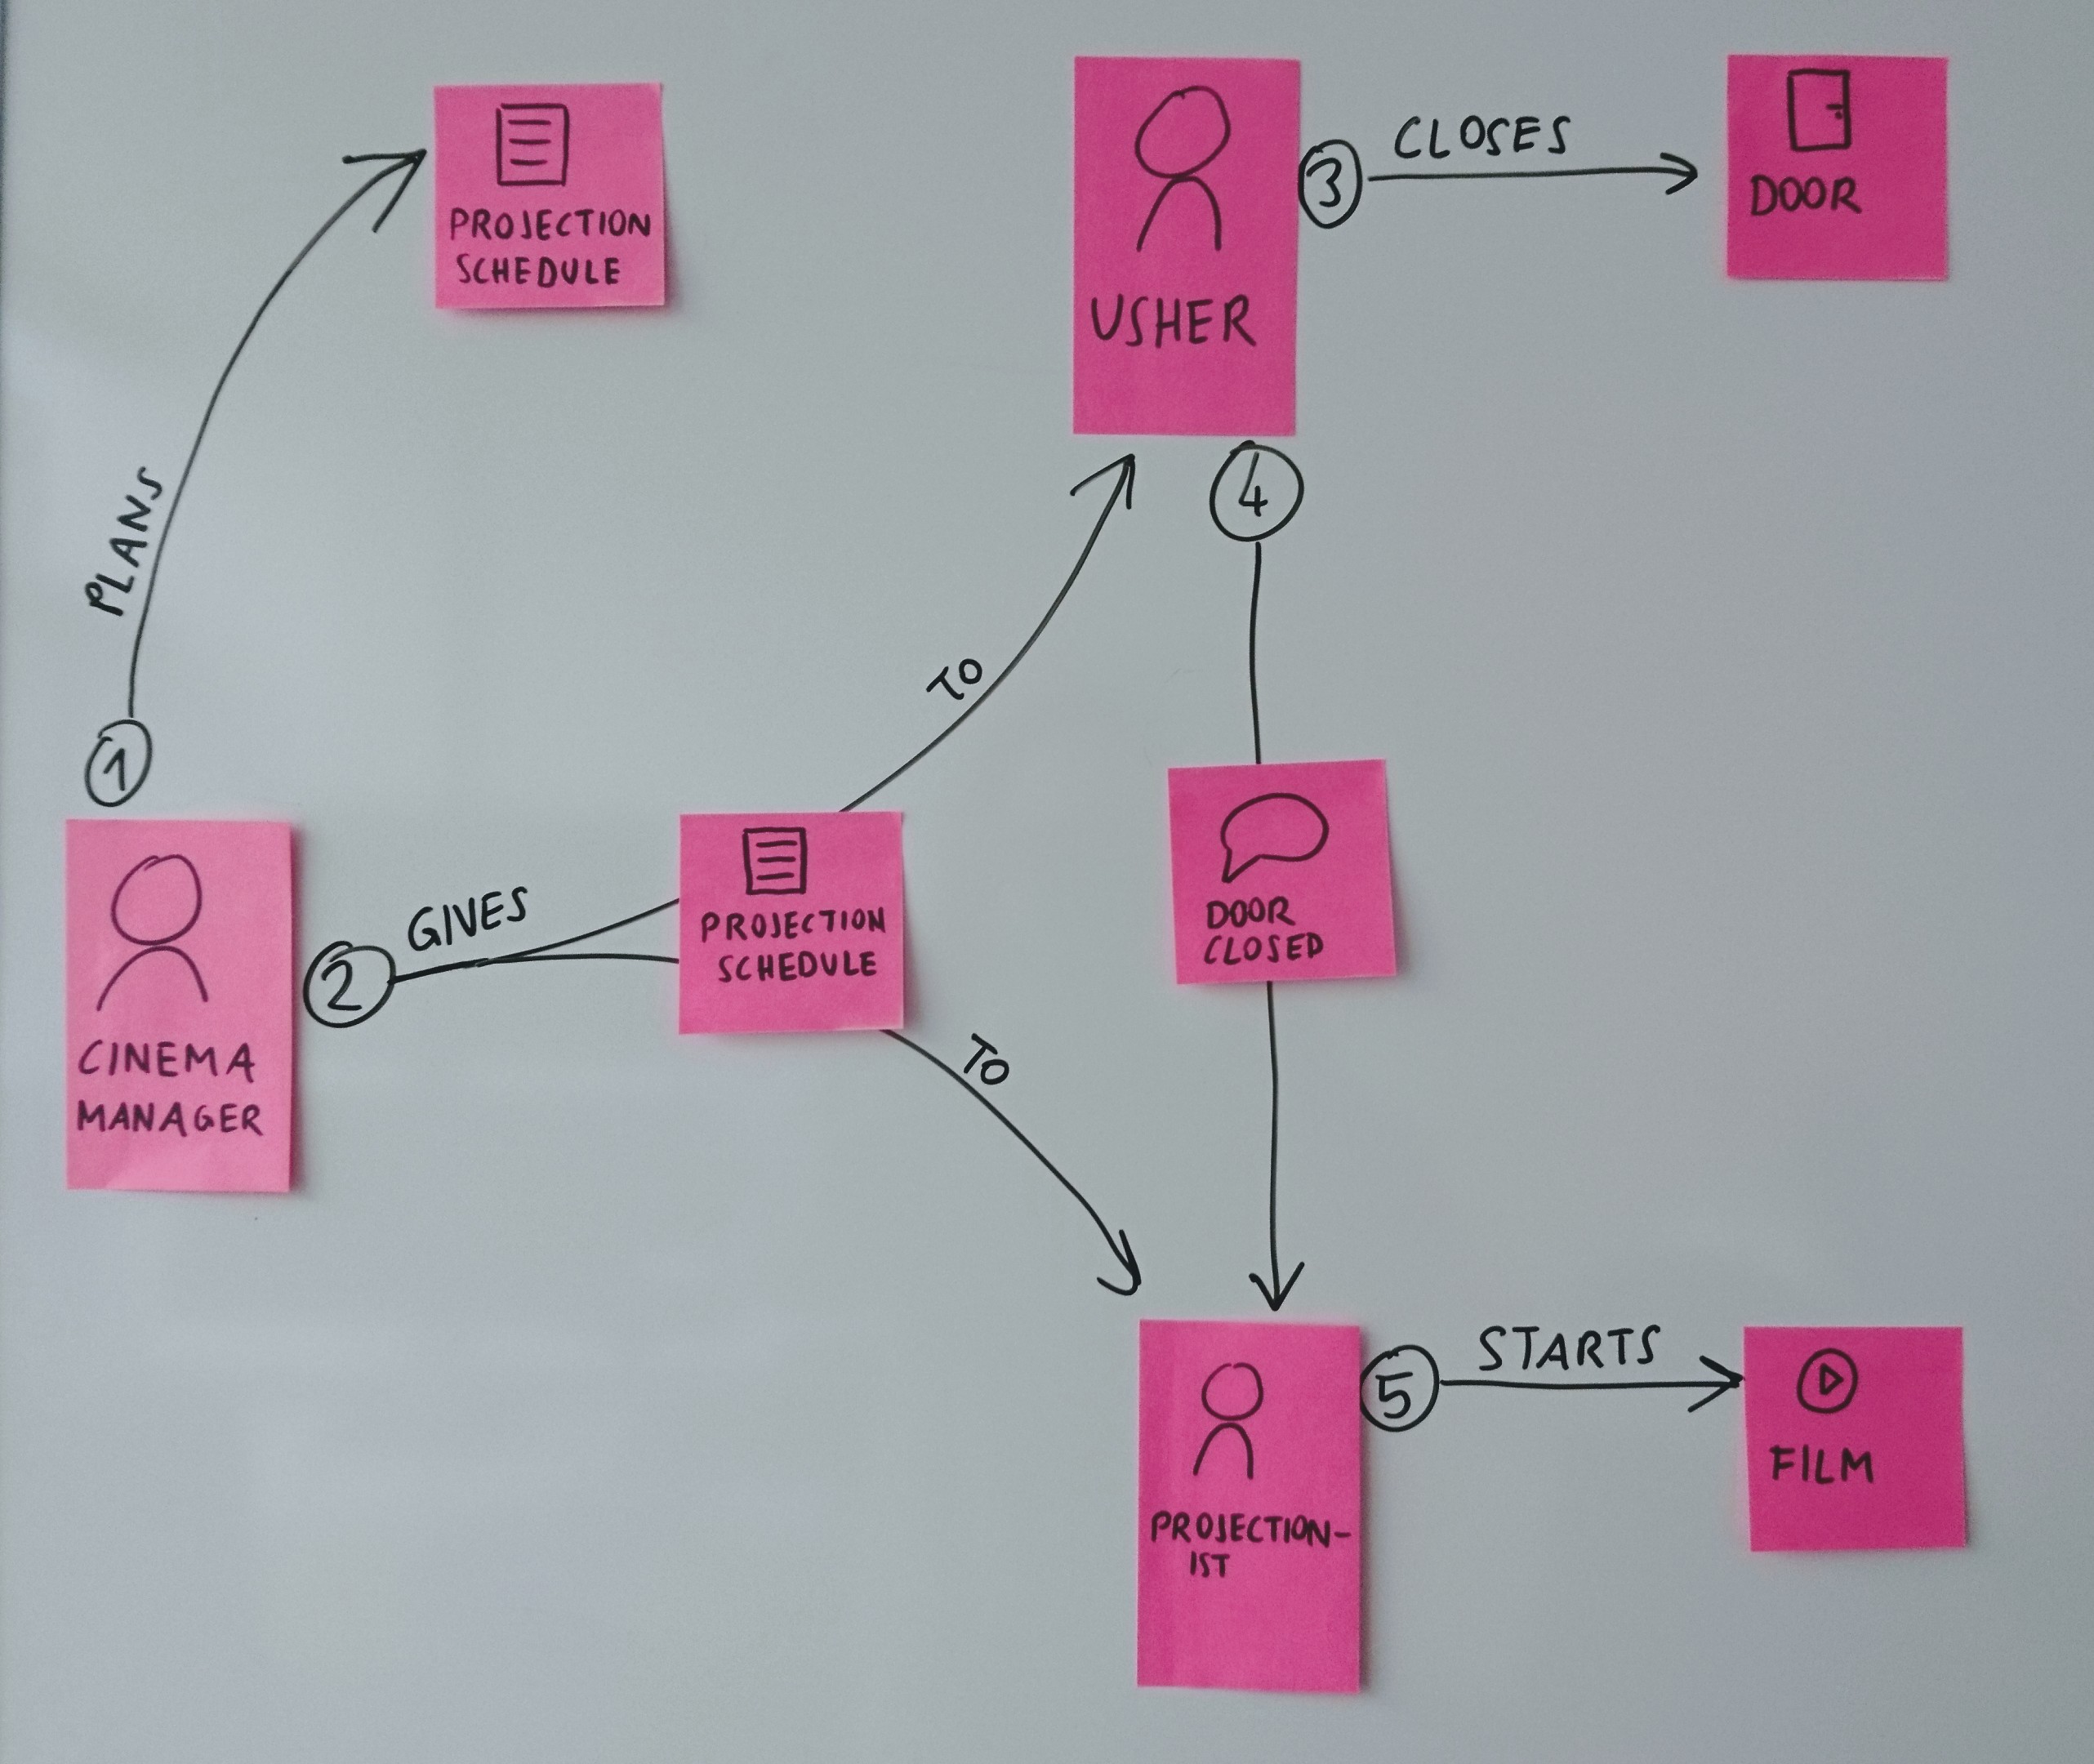
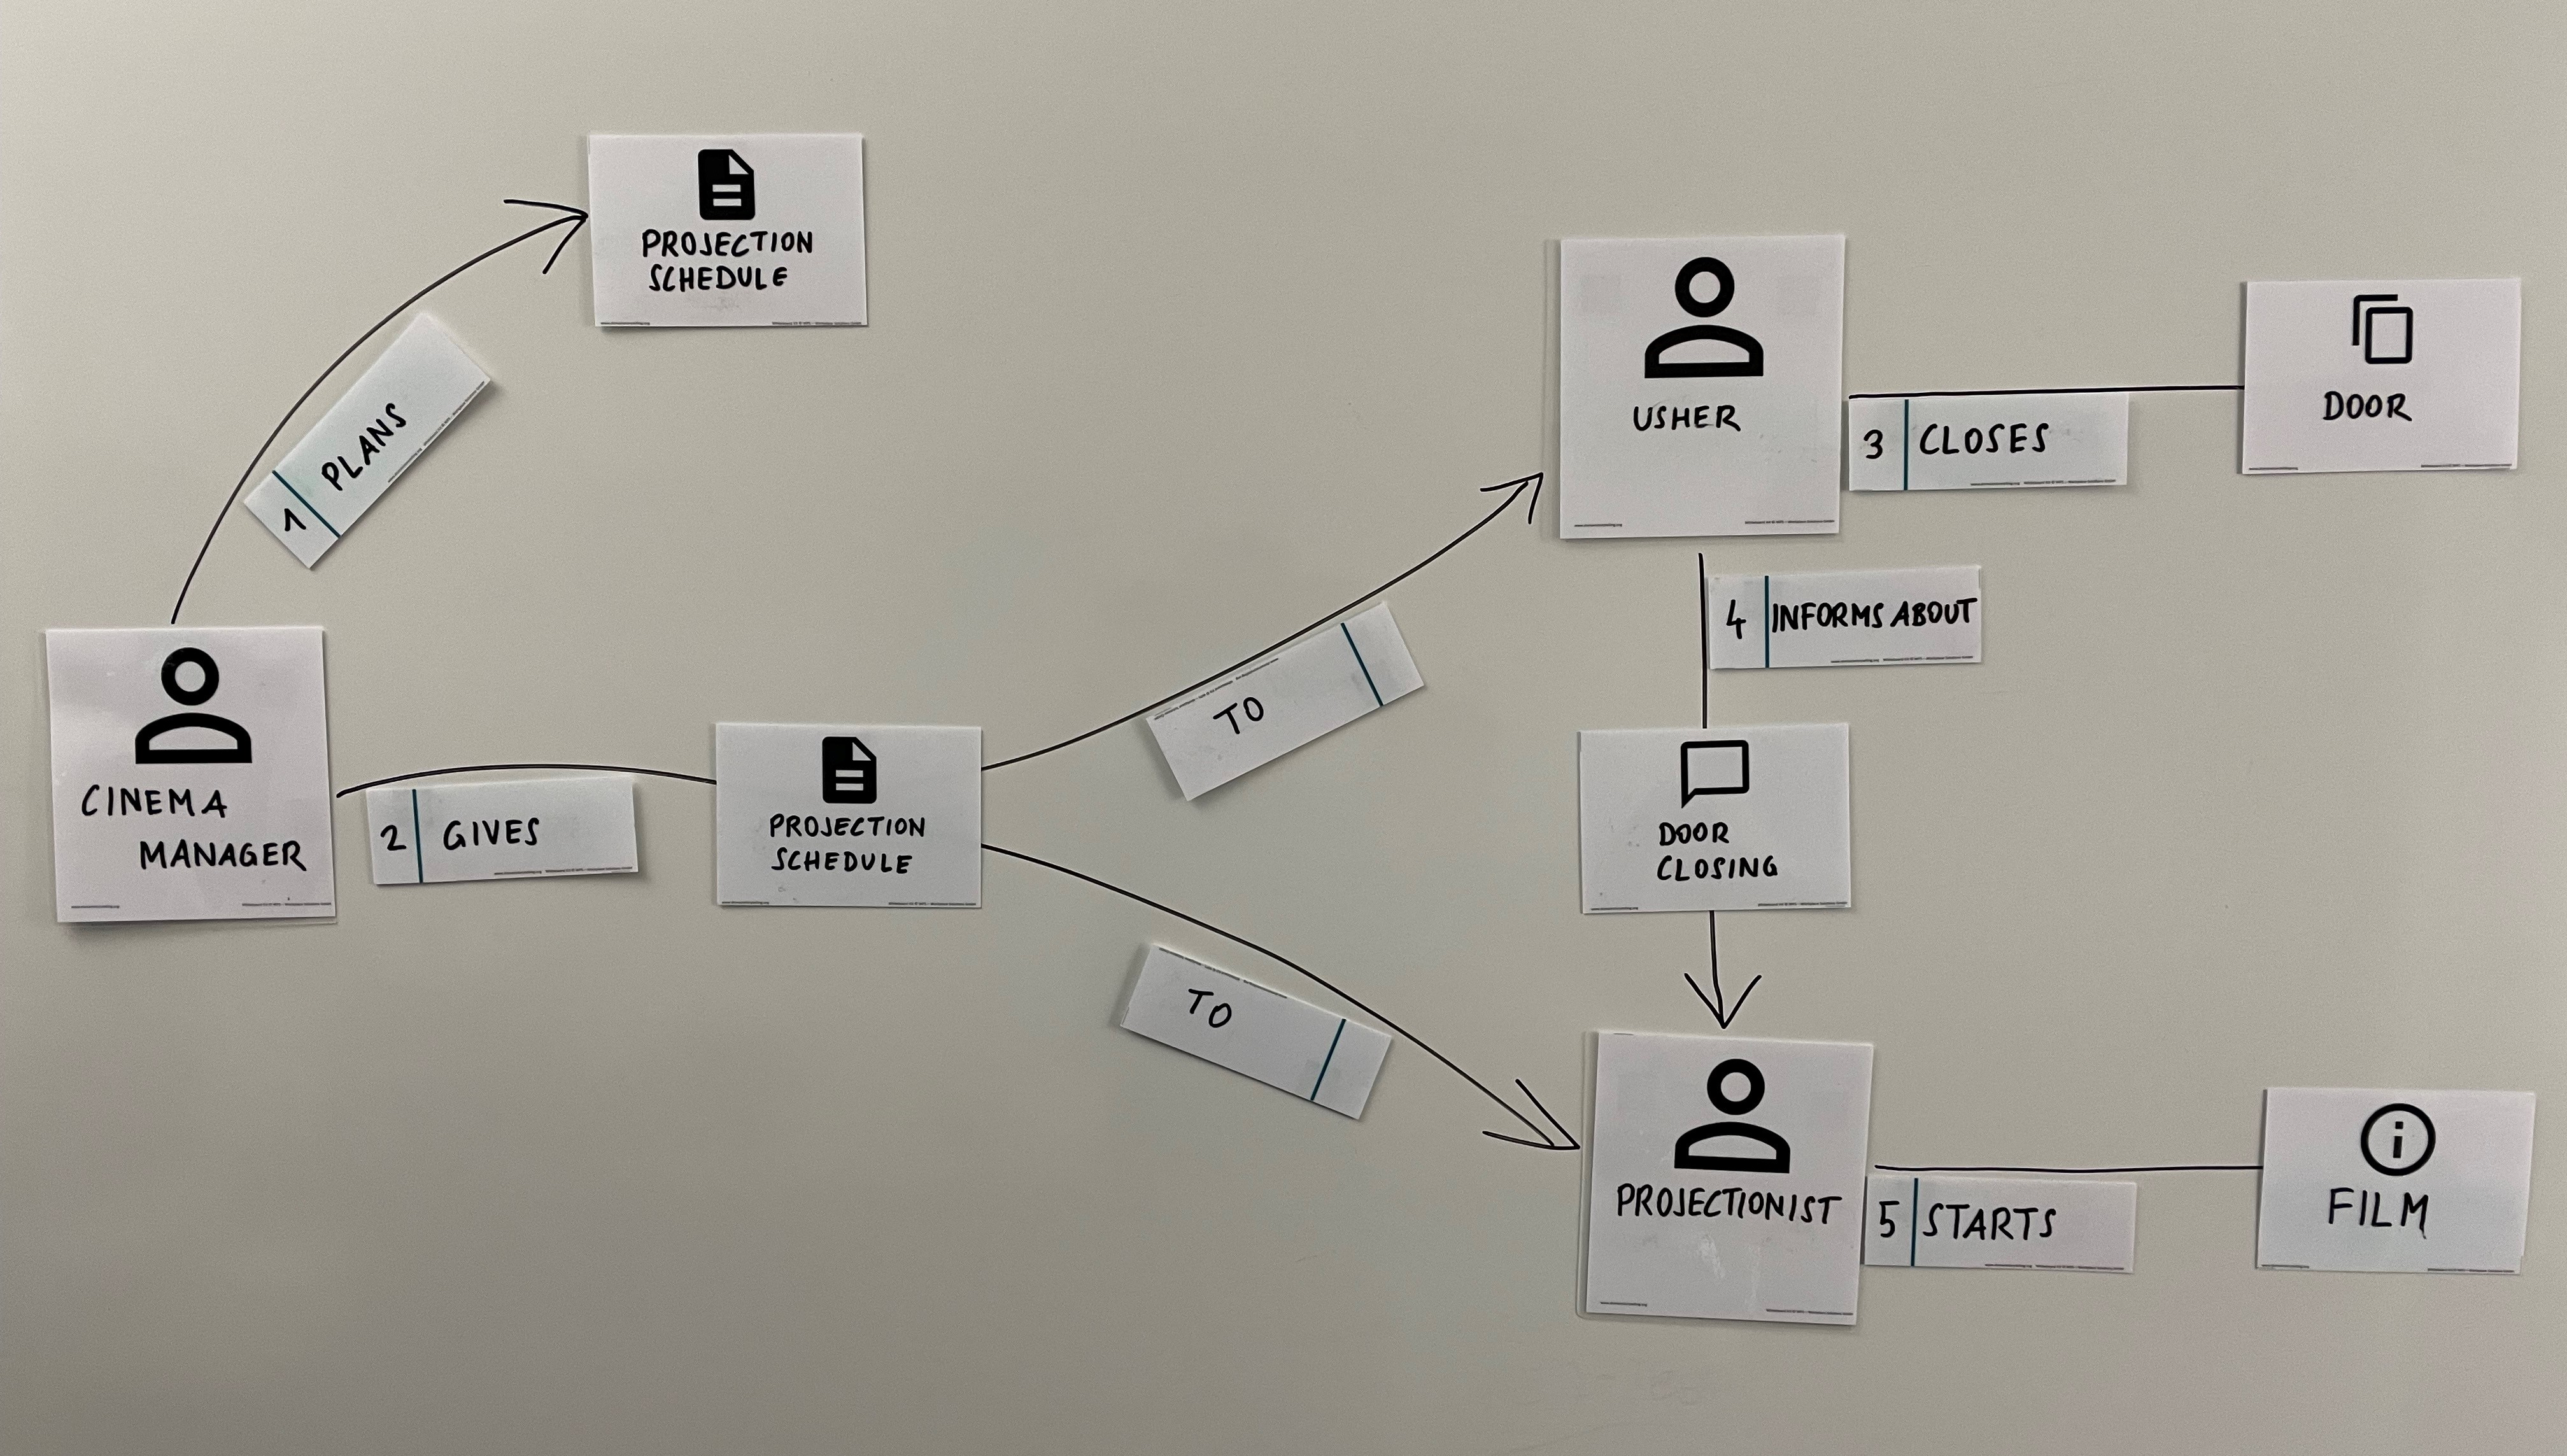
But since drawing the icons can be tedious, we have developed a whiteboard kit to speed up the recording process. You can download this template and make your own kit.
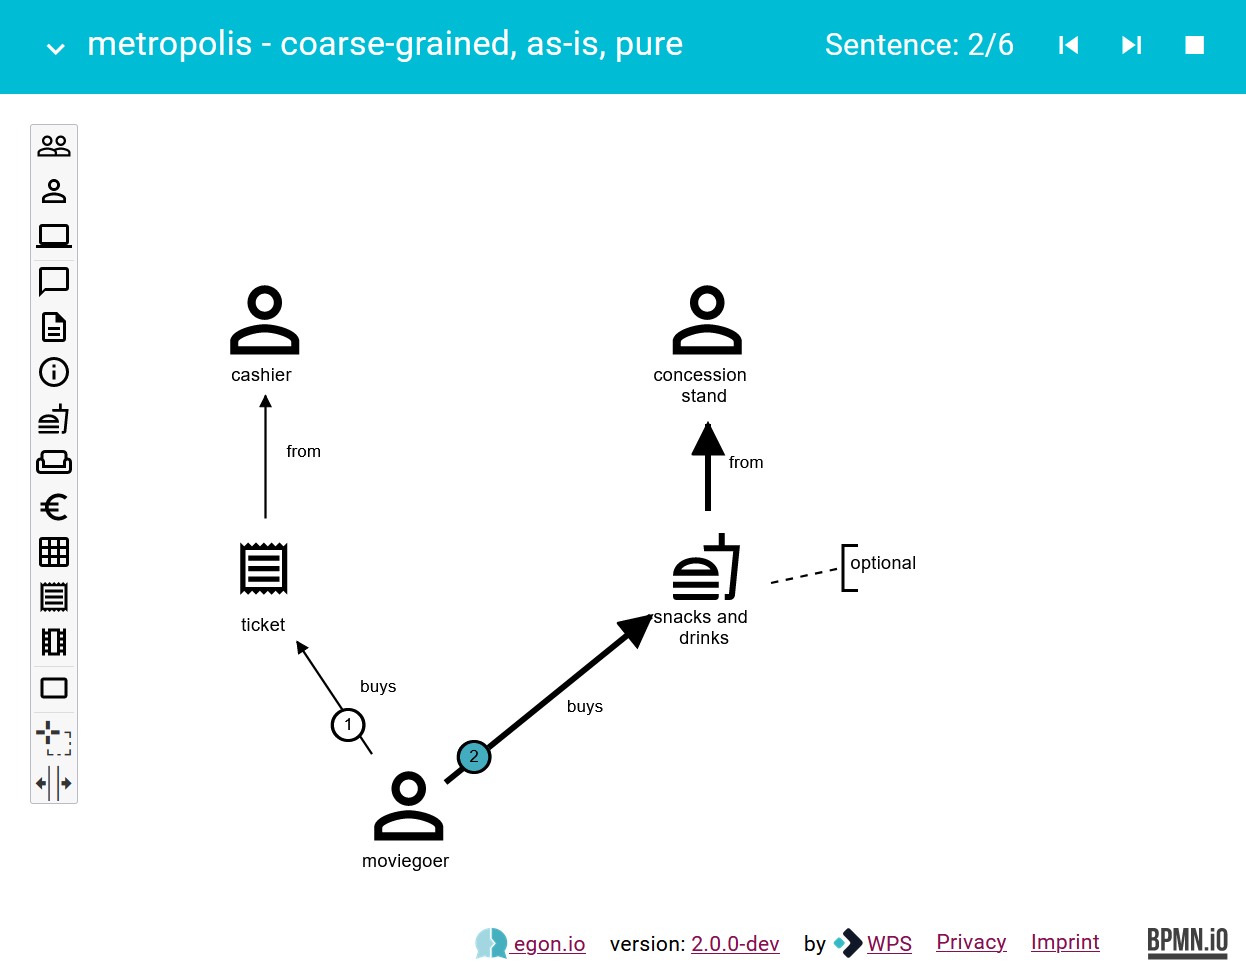
Often, you want to model several Domain Stories in one workshop. But modeling space on whiteboards, flip charts and walls is limited. Digital modeling tools are an alternative. Use a projector to share the computer screen so that everyone can see how the Domain Story evolves. You can visualize Domain Stories with tools like Miro or diagrams.net. However, such general-purpose tools have limitations.
With Egon.io—The Domain Story Modeler, we at WPS – Workplace Solutions built a modeling tool that is specifically designed for Domain Stories.
Egon.io is open source and runs in your browser. No set-up and no registration required. Try it online!
Chapter 5 of the Domain Storytelling book explains the pros and cons of several analog and digital tools, including tips for choosing a tool.